I’m a computational biology, data scientist and bioinformatician living and working in London.
I grew up on the Wirral, which in case you’ve never heard of it is right about here…
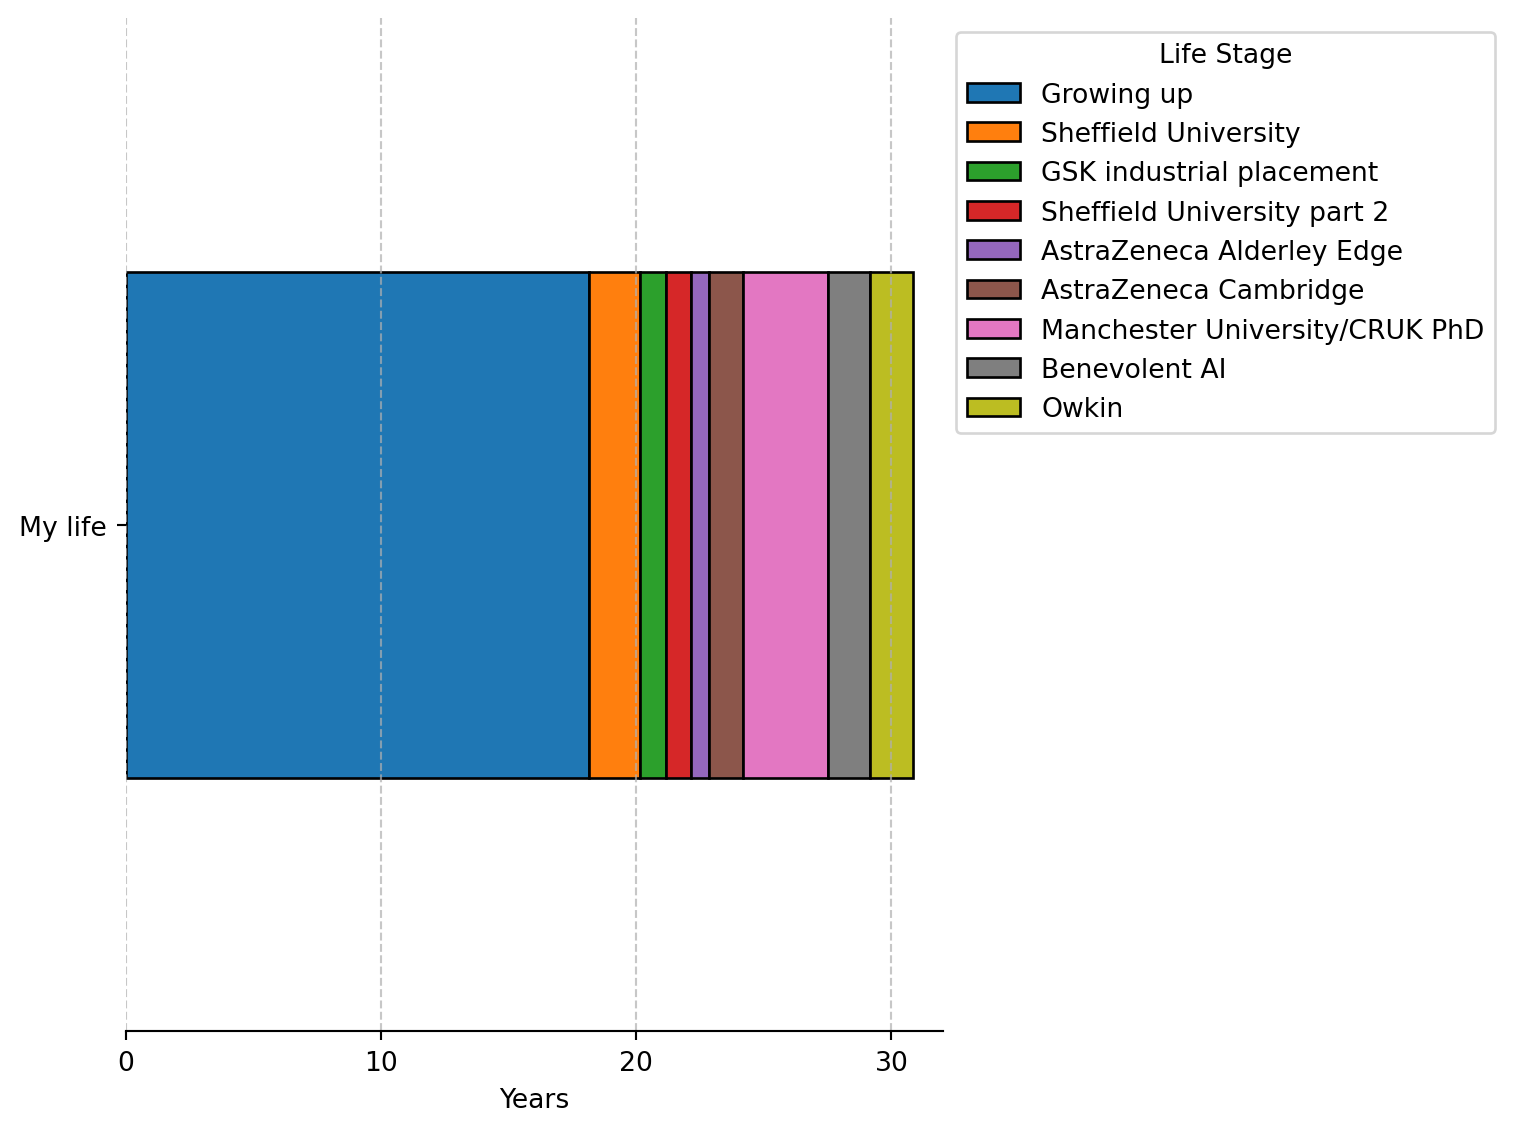
Here’s a bar chart summarising my life and career to date:
Code
import seaborn as snsimport matplotlib.pyplot as pltimport pandas as pd# create datalife = pd.DataFrame({'life_stage': ["Growing up", "Sheffield University", "GSK industrial placement", "Sheffield University part 2", "AstraZeneca Alderley Edge", "AstraZeneca Cambridge", "Manchester University/CRUK PhD", "Benevolent AI", "Owkin"],'role': ["Messing around", "Biomedical science", "In vitro immunology", "Biomedical science", "Animal technician", "In vitro oncology & early clinical development", "Computational biologist & bioinformatician in cancer immunology", "Data science", "Data science" ],'months': [(18*12)+2, 2*12, 1*12,1*12, 8, 2*8, (3*12)+4, 20, 20],'me': ['My life']*9})life.loc[:, 'years'] = life['months'] /12life['life_stage'] = pd.Categorical(life['life_stage'], categories=["Growing up", "Sheffield University", "GSK industrial placement", "Sheffield University part 2", "AstraZeneca Alderley Edge", "AstraZeneca Cambridge", "Manchester University/CRUK PhD", "Benevolent AI", "Owkin"], ordered=True)# Create the plotimport pandas as pdimport matplotlib.pyplot as plt# Sample Data (Replace this with your actual DataFrame)# Assuming 'life' already exists and has columns 'months', 'me', and 'life_stage'life['years'] = life['months'] /12# Convert months to years# Pivot data for stackinglife_pivot = life.pivot_table(index='me', columns='life_stage', values='years', aggfunc='sum')# Plot stacked bar chartfig, ax = plt.subplots(figsize=(8, 6))life_pivot.plot(kind='barh', stacked=True, ax=ax, edgecolor='black')# Customizing the plot to match ggplot2ax.set_xlabel('Years')ax.set_ylabel('')ax.set_xlim(0, 32)ax.set_xticks([0, 10, 20, 30])ax.invert_yaxis() # Flip to match coord_flip()# Remove spines for minimal themeax.spines['top'].set_visible(False)ax.spines['right'].set_visible(False)ax.spines['left'].set_visible(False)# Add legend and gridax.legend(title='Life Stage', bbox_to_anchor=(1, 1))ax.grid(axis='x', linestyle='--', alpha=0.7)plt.tight_layout()plt.show()
/var/folders/p1/91bjgvms5h3c03fp_lkjdsyw0000gp/T/ipykernel_38230/954472691.py:27: FutureWarning: The default value of observed=False is deprecated and will change to observed=True in a future version of pandas. Specify observed=False to silence this warning and retain the current behavior
  life_pivot = life.pivot_table(index='me', columns='life_stage', values='years', aggfunc='sum')